
An organization's main performance indicators and trends can be thoroughly surveyed with the use of dashboard visualization, a potent tool that converts complicated data sets into understandable and useful information. Dashboard visualizations help people make informed decision making by reducing large volumes of data into comprehensible and visually appealing representations. This method improves data interpretation while also making it easier for users to spot trends, correlations, and outliers, which eventually leads to more successful strategic planning and analysis.
We took on the challenging challenge of enhancing a top asset management company's data architecture for efficient dashboard visualization in collaboration with them. With a massive dataset of over 500 TB coming from 47 different sources and daily client-generated CSV data, the previous system experienced issues. Our goal was very clear: we wanted to improve dashboard reporting for C-level executives and optimize their MSSQL Data Warehouse. We greatly enhanced the visual reporting capabilities and streamlined data integration with creative visualization techniques and smart reorganization.
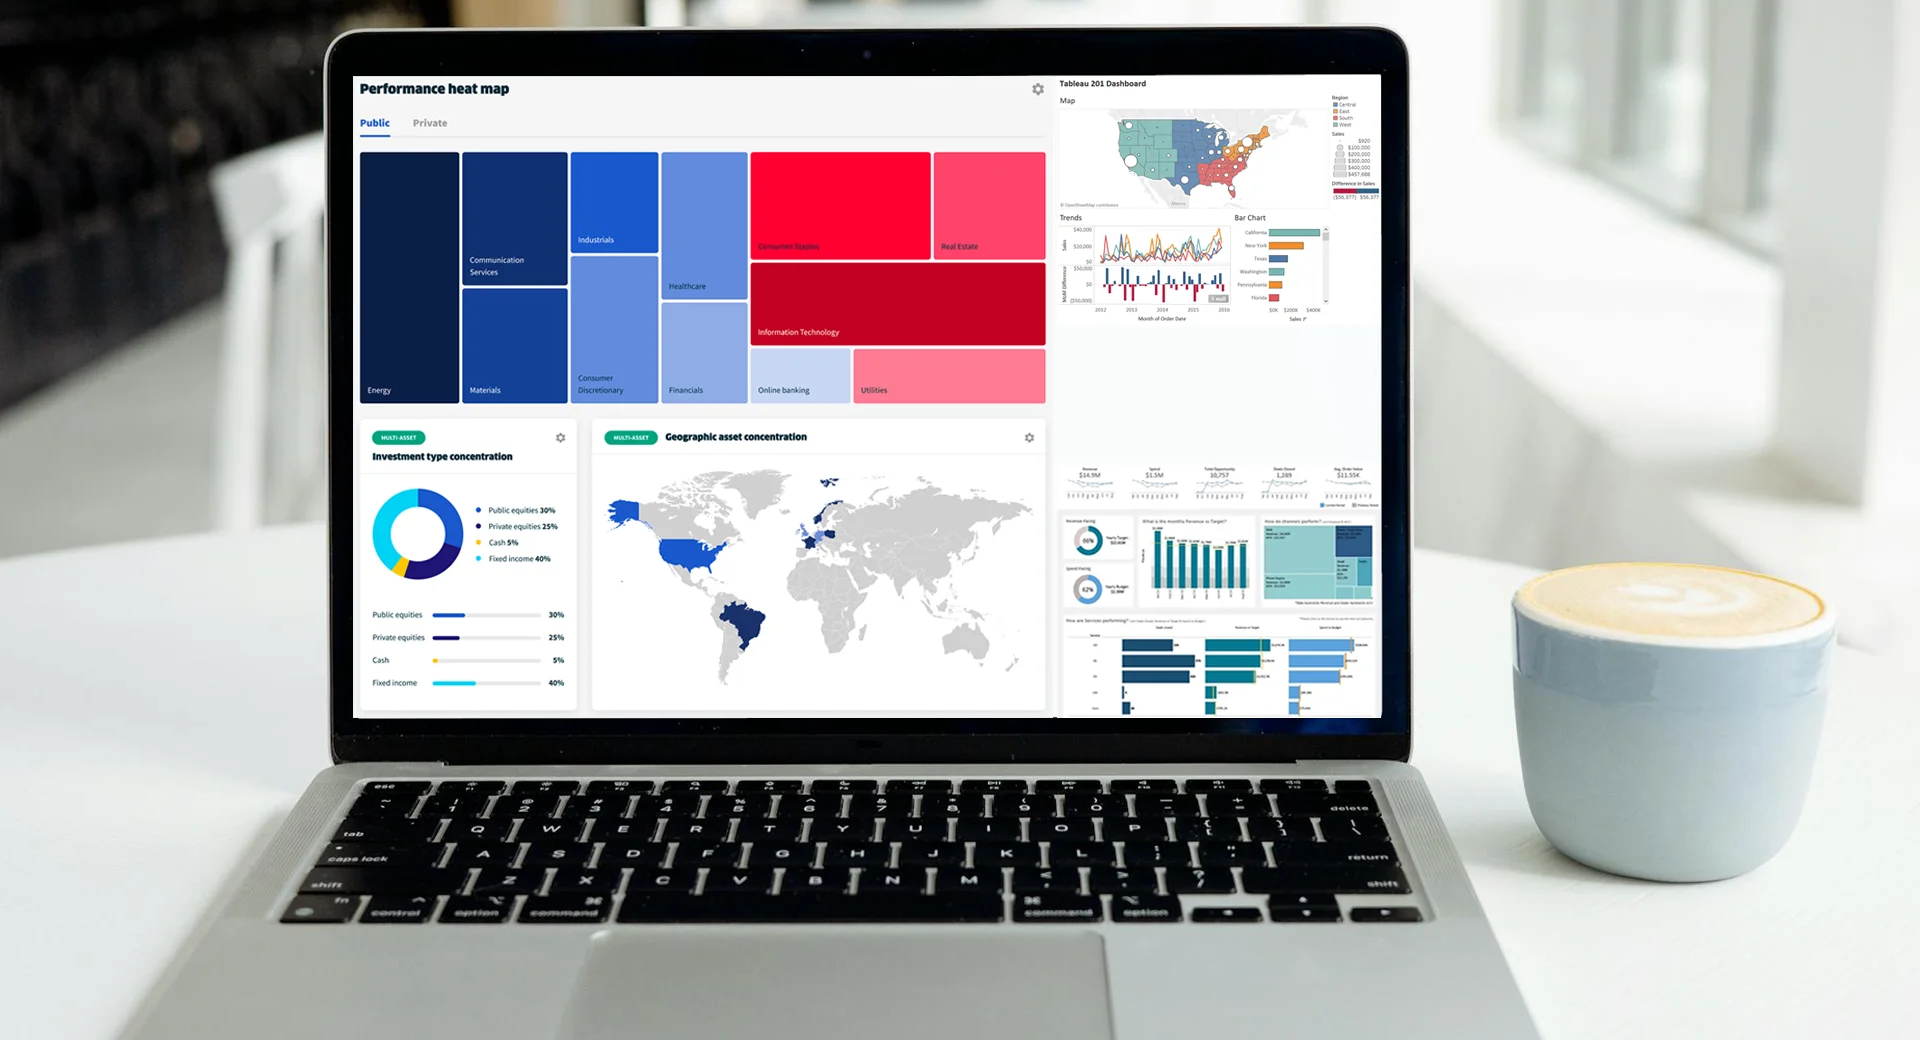
Our solution leverages the power of Snowflake's Enterprise Database on Amazon Cloud to improve speed and performance for our client's large data operations. An organized, staged/raw, and curated ETL process receives data from daily CSV outputs and outside SFT sources. Snowflake tasks facilitate effective data flow with client-specific schemas, dynamic table creation, and real-time monitoring. Tableau dashboards with a live connection have row-level security, powerful visualizations, and different views for optimal reporting. Figma/XD design templates boost visual appeal, while dynamic parameters allow for real-time data analysis. Through synchronized actions, knowledge base links, and tooltips, the user experience is enhanced, guaranteeing optimal performance and smooth integration.
Dashboard visualization improves display presentations and facilitates well-informed decision-making by offering real-time insights and optimal data processing.This guarantees our clients' experiences with streamlined procedures and enhanced user engagement for data-driven success.
Dashboard Visualization
Various
Middle East and Europe